

Google’s Data Analytics Professional Certificate is an online training program designed to equip beginners with job-ready data analytics skills. It’s part of the Grow with Google Career Certificates initiative, aimed at helping career changers and aspiring analysts break into the high-growth field of data analytics. No prior experience or degree is required – all you need is basic high school-level math and a willingness to learn.
The program was developed by Google and is hosted on Coursera (and also via Google’s Career Certificates platform), combining video lessons, quizzes, and hands-on projects to simulate real-world data analysis scenarios. Upon completion, learners earn a Google Data Analytics Professional Certificate, which is a shareable credential you can add to your résumé and LinkedIn profile. This certificate signals to employers that you have foundational knowledge in data analytics and are ready for entry-level roles in the field.
A data analyst reviewing data visualisations on a computer. The Google Data Analytics Professional Certificate trains learners in the end-to-end process of data analytics, from collecting and cleaning data to analysing and visualising insights.
Program Overview and Course Structure
![]()
The Google Data Analytics Certificate consists of eight courses (modules) that follow the workflow of a data analysis project from start to finish. Each course builds on the previous one, taking you through the data analysis process: asking the right questions, preparing and cleaning data, analysing and visualising results, and finally applying your skills in a capstone project.
Throughout the courses, you’ll also learn about best practices, career tips, and how to think like a data analyst. Below is a breakdown of all eight courses and what you’ll learn in each:
Course 1: Foundations: Data, Data, Everywhere
This introductory course covers the basic concepts and ecosystem of data analytics. You’ll learn what data analytics is and the role of a data analyst in various industries.
The course introduces key analytical skills and the tools data analysts use, including spreadsheets, SQL databases, data visualization tools, and programming in R. By the end of this module, you will be able to define core data terms (like data life cycle and data analysis process), understand how data-driven decision making works, and recognize how tools such as spreadsheets and SQL are applied in analytics.
You’ll also assess your own analytical thinking skills and explore the types of entry-level data analyst jobs available, setting the stage for your learning journey.
Course 2: Ask Questions to Make Data-Driven Decisions
In the second course, you dive into the business problem-solving aspect of analytics. A major theme here is learning how to ask effective questions and apply structured thinking to guide data analysis.
You’ll discover techniques for understanding stakeholder needs and making data-driven decisions based on evidence. Practical exercises involve using spreadsheets for basic tasks like data entry, organisation, and simple analysis.
By the end of this module, you will know how to frame analytical questions, apply a problem-solving roadmap to real-world scenarios, and use spreadsheets to support your analysis. The course also emphasises communication skills – you’ll learn strategies for managing stakeholder expectations and communicating clearly with your team so that your analysis aligns with business objectives.
Course 3: Prepare Data for Exploration
Course 3 focuses on the data preparation stage, teaching you how to collect and store data properly before analysis. You’ll learn what factors to consider when deciding what data you need and how to gather it. The content covers different types of data (structured vs. unstructured, various formats and types) and how to ensure your data is unbiased and credible.
An introduction to databases is provided: you’ll see how data analysts use database management systems and SQL queries to extract data from large datasets. By the end of this course, you will be able to identify appropriate data sources for a given problem, understand how to access and query databases using SQL, and apply best practices for organising data and keeping it secure.
Ethics and privacy are also stressed – you’ll explore open data sources and learn about data ethics and privacy considerations when handling data.
Course 4: Process Data from Dirty to Clean
In any real-world scenario, raw data is often messy. This fourth course teaches you how to clean and preprocess data, turning “dirty” data into usable data. You’ll learn to check for data integrity and identify errors or inconsistencies in datasets.
The coursework includes hands-on practice with cleaning data using spreadsheet techniques and SQL queries. For example, you might use functions to find and remove duplicates or correct inconsistencies, both in a spreadsheet and by writing basic SQL statements to clean data in a database.
By the end of Course 4, you will have the skills to apply various data cleaning techniques (such as handling missing values or outliers), ensure data quality, and verify that your cleaning process has improved the dataset. Importantly, you’ll also learn how to document your work by creating an effective data cleaning report, so that stakeholders or teammates can understand the cleaning steps you performed.
Course 5: Analyse Data to Answer Questions
Now that your data is prepared, Course 5 moves into the analysis phase. This module is all about applying analytical techniques to derive insights and answer the questions you posed earlier. You’ll practice organising and aggregating data using tools like pivot tables in spreadsheets and JOIN queries in SQL to combine data from multiple tables.
The course also covers using formulas and functions to calculate statistics or metrics that help explain what the data is saying.
By the end of this course, you will be able to take a prepared dataset and perform exploratory analysis: sorting and filtering data to find patterns, using spreadsheet functions (like lookup or math functions) to compute results, and writing SQL queries to conduct analysis on databases. Essentially, you learn to turn raw numbers into meaningful answers for business questions.
Course 6: Share Data Through the Art of Visualisation
Even the best analysis won’t make an impact unless you can communicate it effectively. Course 6 is about data visualisation and presentation. You’ll learn why data visualisation is important and how to transform analysis results into compelling visuals that tell a story.
The course introduces Tableau, a popular data visualisation software, and shows you how to create interactive dashboards and charts in Tableau. You’ll also discuss what makes an effective data story – how to craft a narrative around your findings that resonates with your audience. By the end of this module, you will know how to build informative charts and dashboards (e.g. bar charts, line graphs, geographic maps) to highlight key insights.
Furthermore, you’ll pick up presentation skills: the principles of designing clear slides, how to talk about data to non-technical stakeholders, and best practices for handling Q&A sessions after presenting, including addressing the limitations of your data honestly.
Course 7: Data Analysis with R Programming
One unique aspect of Google’s certificate is that it includes a programming component using R, a language specialised for data analysis. In Course 7, you’ll get introduced to R and the RStudio environment, which is a software platform for writing and running R code. Don’t worry if you’ve never coded before – this course starts with the fundamentals of R: using variables, basic data types, functions, loops, and more.
You will also learn about R’s powerful ecosystem of packages, particularly the Tidyverse collection of packages, which make common data tasks easier (like dplyr for data manipulation and ggplot2 for visualisation). By the end of this course, you will be able to use R to clean and analyse data programmatically – for instance, reading a CSV file into R, filtering or transforming the data with code, and creating plots using R’s visualisation libraries.
You’ll also learn how to produce reports of your analysis with R Markdown, a tool that lets you combine R code and narrative text (useful for documenting your work). This programming experience gives you another valuable tool in your analyst toolkit (Note: the program focuses on R and does not cover Python, another common data language – Google encourages learners to explore Python on their own after completing the certificate if they wish).
Course 8: Google Data Analytics Capstone: Complete a Case Study
The final course is a capstone project where you’ll apply everything you’ve learned in a realistic scenario. You’ll choose a case study (a sample business problem and dataset) and go through all the steps of the data analysis process: ask questions, prepare the data, process and clean it, analyse the data, and then visualise and present your findings.
This project is an opportunity to synthesise your skills and produce a tangible example of your work, essentially building a mini data analytics portfolio piece. Alongside the case study, this course offers tips on how to approach data analysis, interviews, and build your professional portfolio. By the end of the capstone, you will have a completed case study that you can show to potential employers, demonstrating your ability to handle a data project end-to-end.
The course also discusses how case studies and portfolios are used in job interviews and gives you practice with common interview questions for data analyst roles. (Bonus: Google recently integrated new AI tools into the curriculum, and this capstone includes guidance on how to leverage AI for tasks like data cleaning, visualisation brainstorming, and improving your R code. Learners gain exposure to emerging AI techniques to further boost their analytics skills.)
Hands-On Learning: Across these courses, expect over 180 hours of instruction and hundreds of assessments (quizzes, exercises, etc.) that simulate real analytics tasks. Each module includes video lectures from Googlers (Google employees) with practical experience, plus plenty of practice activities to apply what you learn. By working through these, you’ll build confidence in using the tools and methods on your own. In fact, the program emphasizes practical skills like data cleaning, analysis, visualization, and problem-solving, so that you finish with both knowledge and experience applying it. The capstone ensures you leave with at least one detailed project under your belt, which is great for job interviews or showcasing on your LinkedIn.
Tools and Technologies Covered
One of the strengths of the Google Data Analytics Certificate is the exposure to industry-standard tools and software. As you progress through the courses, you will get hands-on practice with the following technologies:
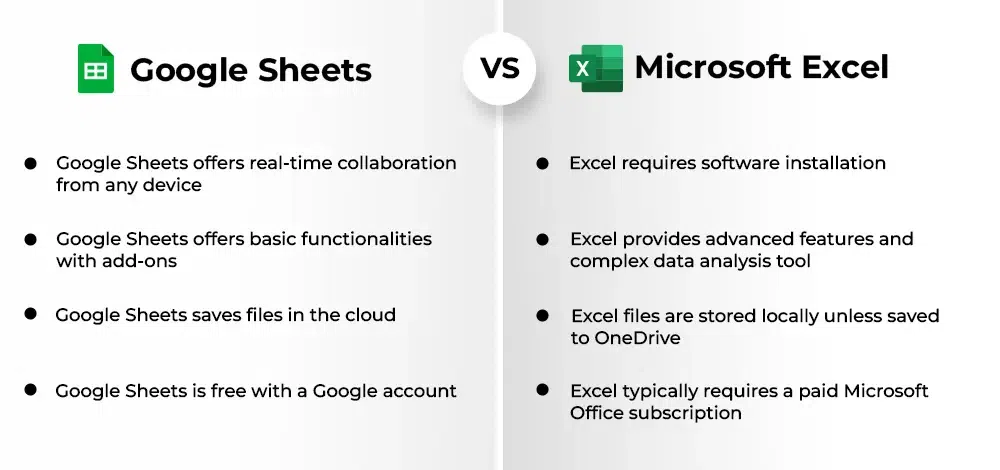
- Spreadsheets (Excel or Google Sheets): Spreadsheets are introduced early and used throughout for tasks like data entry, cleaning, analysis with formulas, pivot tables, and basic visualisations. Google’s curriculum lets you use Google Sheets or Microsoft Excel interchangeably. Mastering spreadsheet skills is crucial, since many entry-level analyst tasks (cleaning small datasets, quick calculations, reporting) are done in Excel/Sheets.
- SQL (Structured Query Language): SQL is the language for working with relational databases. You’ll learn to use SQL to extract data from databases, join tables, and perform aggregations. The course provides a platform to practice writing SQL queries – this might be done via an online database interface or using tools like BigQuery (Google’s cloud data warehouse) or a SQL simulator. By the end, you’ll be comfortable using SQL queries to manipulate and analyse large datasets beyond the limits of a spreadsheet.
- Data Visualisation Tools: The program teaches you how to create charts and dashboards to present data. It specifically features Tableau, a leading business intelligence tool, for building interactive visualisations. You’ll learn how to connect data sources in Tableau and design dashboards with filters, which is a valuable skill for many analyst jobs. In addition, you’ll use presentation tools like Google Slides or Microsoft PowerPoint to craft presentations that communicate your findings. The ability to present data insights clearly is a key learning outcome.
- R Programming and RStudio: As noted, the certificate includes training in R, an open-source programming language for statistical analysis. You will use RStudio, which is an integrated development environment for R, to write code and analyse data. Through R you’ll learn to perform more complex or automated data transformations and create advanced visualizations (for example, using the ggplot2 library for custom charts). This adds a programming component to your skill set, complementing the point-and-click skills from spreadsheets and Tableau.
- Kaggle: Kaggle is mentioned as one of the platforms included in the curriculum. Kaggle is an online community for data science and machine learning; it provides free datasets and a cloud notebook environment. Google likely uses Kaggle’s notebooks for some of the R programming exercises, allowing learners to write and run R code in the browser without installing anything. This helps you get a feel for working in an online coding environment and possibly interacting with Kaggle datasets or competitions.
- Other Tools: The curriculum also touches on using collaboration and documentation tools. For example, you’ll use R Markdown for documenting analyses in R. You’ll also learn about data ethics and privacy tools or frameworks conceptually (though not a software tool per se, understanding data governance is part of the skill set). And as part of the optional content, you’ll see demonstrations of AI tools (Google mentions leveraging AI like the upcoming “Gemini” or NotebookLM in the job search course) to automate or enhance parts of your work.
Overall, by completing the certificate, you become familiar with the core toolkit of a junior data analyst: spreadsheets for analysis and reporting, SQL for database queries, a visualisation tool (Tableau) for dashboards, and R for programming and statistical analysis. These are exactly the tools many companies use on the job. The program focuses on R instead of Python, which is worth noting if you have a specific preference – Google chose R because it’s beginner-friendly for data analytics, but they encourage learning Python separately afterwards if you want to expand your programming skills.
Time Commitment and Pace
One common question is: How long does it take to finish the Google Data Analytics Certificate? The program is designed to be flexible and self-paced. Google and Coursera recommend an average pace of about 10 hours per week, which would allow you to complete all the coursework in roughly 6 months. This is an estimate – you can speed up or slow down as needed. If you can dedicate more time each week, you could finish faster. In fact, Google notes that it’s possible to finish in about 3 months by studying ~20 hours per week, whereas if you can only spare a few hours weekly, it might take longer than six months.
The certificate consists of 8 courses, and in total, it contains approximately 240 hours of content (videos, readings, exercises, etc.) across all courses. Some learners on forums have noted that if you already have some background or you skip certain optional materials, you might complete it in fewer hours, but 240 is a good ballpark for beginners. Each individual course ranges from about 11 hours to 30 hours of content (as listed on Coursera) that you can tackle at your own pace. For example, the earlier courses are around 12–18 hours each, the R programming course is one of the longer ones (~30 hours), and the capstone is about 10–12 hours of work.
You do not have deadlines aside from your own schedule, which is great for working professionals. The learning is entirely online and self-directed – you can start anytime, and there are no live classes. This flexibility means you can adjust your pace. However, to keep momentum, many find it helpful to set aside consistent weekly time for it. If aiming for six months, ~10 hours per week could be two hours per weekday, or perhaps longer sessions on weekends. The platform (Coursera) allows you to break down each course into weekly suggested schedules if you prefer some structure, but you’re free to binge through faster or pause when needed.
Google’s guidance is that many learners finish within 3 to 6 months. There is also a 7-day free trial at the start (more on cost below), so you could even test the content in the first week to gauge how quickly you can progress. And if life gets busy, you can take a break and come back – your progress is saved and you can resume whenever, since you maintain access as long as your subscription is active.
Pricing and Cost Structure
The Google Data Analytics Professional Certificate is offered on Coursera, which uses a subscription model for most professional certificates. The cost is $49 USD per month on Coursera after a 7-day free trial. This means you pay for each month you are enrolled in the program. The faster you finish, the less you pay in total. Conversely, if you take longer, you’ll pay for each additional month.
To give an idea of the total investment: if you complete it in the recommended 6 months, it would cost about $294 (6 months × $49/month). Some learners who push through in 3 months might pay around $147 total. Coursera’s pricing can vary slightly by region, and they occasionally adjust rates, but $49/month is the standard in many countries (some regions see $39 or $59, but $49 is common). Be sure to check Coursera in your location for the exact price.
Importantly, Financial Aid is available. If the cost is a barrier, Coursera allows you to apply for financial aid directly on the course page, which, if approved, can grant you access to the certificate for free or at a reduced cost. Google is committed to accessibility, and many learners have taken advantage of this option. The financial aid application usually asks for some information about your need and can take a couple of weeks to process, so plan accordingly.
Another cost-effective option is Coursera Plus – a subscription (~$399 per year) that gives unlimited access to thousands of courses and certificates, including Google’s. If you plan to take multiple courses or certificates on Coursera, this could be worthwhile. Also, note that you can cancel your subscription at any time. For example, if you finish in 4 months, you can cancel and you won’t be billed further.
In summary, expect a monthly fee while you’re learning, with the total cost roughly $150–$300 for most learners by completion. The certificate itself does not have any separate exam fee or certification fee beyond the course subscription. Once you finish all the required courses and assessments, the digital certificate is awarded at no extra charge. And remember the 1-week free trial – it’s a good chance to dip your toes in and see if the content and the Coursera platform suits you.
Certification Credentials and Career Impact
After completing all 8 courses and the capstone project, you will earn the Google Data Analytics Professional Certificate. This comes as a digital certificate (you can download a PDF and share a link) issued by Google via Coursera. It’s a shareable credential – you’re encouraged to add it to your LinkedIn profile and include it on your resume to showcase your achievement. The certificate does not expire, and it indicates that you’ve completed a rigorous training program in data analytics.
What does this credential mean for your career? For one, it signals to employers that you have a solid foundation in data analytics, including experience with spreadsheets, SQL, data visualisation, and R – essentially, it certifies you as “job-ready” for entry-level data analyst roles. Google has reported that 75% of completers say it had a positive impact on their career within 6 months, such as getting a new job or a promotion. While the certificate itself is not a guarantee of employment, it is well-recognised in the industry. Google has formed an Employer Consortium of over 150 companies (including big names like Deloitte, Target, Verizon, Infosys, and Google itself) that vow to consider certificate graduates for relevant entry-level positions. Upon completion, you gain access to a special job portal where these employers post openings and you can apply directly as a certificate holder.
Many learners leverage the projects and skills from the certificate to transition into roles such as Junior Data Analyst, Business Analyst, or even related areas like Marketing Analyst or Data Technician. The certificate’s focus is on analysis, but those foundational skills also overlap with data science and database administration – the program notes that graduates are prepared to pursue roles not just as data analysts, but even to grow into data scientist or database admin roles with further experience. Essentially, it’s a strong starting point in the data field.
In addition to the certificate credential, Google now includes the optional “Accelerate Your Job Search with AI” course (approximately 6 hours) at the end of the program. This bonus course helps you build your job-seeking skills – things like writing a resume and cover letter, optimising your LinkedIn, and practising interview questions – with a modern twist of using AI tools to assist in the process. Completing this optional module does not give a separate certificate, but it’s a useful add-on to help turn your new skills into a job offer. Google provides resources for alumni, such as coaching on how to present your certificate and projects to employers, and even things like mock interview preparation.
It’s also worth mentioning that the Google Data Analytics Certificate can serve as a stepping stone to further education. Some universities and colleges are beginning to recognise Google Career Certificates for academic credit. For example, institutions like Purdue University Global and Franklin University allow learners who have completed the Google Data Analytics Professional Certificate to earn credit towards a bachelor’s degree program. While not universally applicable, this is a testament to the certificate’s rigour – it’s considered equivalent to certain college-level coursework. If you plan to pursue a degree later, check if your school has credit transfer or partnerships for this certificate (the Coursera page and Google’s site list some participating institutions).
Is the Google Data Analytics Certificate Right for You?
The Google Data Analytics Professional Certificate is especially suited for people looking to launch a career in data analytics or switch into a data-focused role from another field. If you find yourself intrigued by data, enjoy solving problems, and want a structured way to learn the tools of the trade, this program provides a comprehensive, beginner-friendly path. It starts from square one (explaining “what is data?” and the responsibilities of an analyst), so you won’t feel lost if you’re new to tech. At the same time, it dives into real-world applications and hands-on practice by the end, so you come away with tangible experience.
Consider enrolling if any of these describe you:
- Career Changer: You’re currently in a non-analytics job (e.g., sales, teaching, operations) and want to pivot into the data analytics field. This certificate can help you build the portfolio and credibility to make that switch, as it covers all the fundamental skills employers look for in junior analysts.
- Recent Graduate (or No Degree): You don’t have a formal background in data or maybe not even in technology, but you want to enter a growing field without going back to college. Google’s certificate requires no degree and has no prerequisites, providing a way to get a recognised credential in months instead of pursuing another 2- or 4-year degree.
- Enhancing Your Current Role: You might be in a role that is increasingly requiring data analysis (for example, marketing, finance, HR), and you want to upskill. Learning data analytics through this program could help you perform better in your current job and open up new opportunities. The flexibility of the online format means you can learn while working full-time.
- Self-Paced Learner: If you prefer to learn at your own speed rather than a set class timetable, you’ll appreciate the self-paced nature. You can speed through topics that come easily and spend more time on challenging ones. And you can balance it with other life commitments. Google’s estimate of ~10 hours a week is manageable for many people – think of it like setting aside time similar to a part-time evening course, but with the luxury of adjusting when needed.
However, to set the right expectations, this is an introductory, entry-level certificate. It gives breadth of knowledge across the data analysis workflow, but not extreme depth in any one area (which is appropriate for beginners). For instance, you’ll learn the basics of writing SQL queries and R scripts, but you won’t become a full database administrator or software developer from this alone. If you already have substantial data analytics experience or a degree in a related field, this certificate might feel too basic for you (in that case, you might look at Google’s more advanced offerings like the Google Advanced Data Analytics Certificate, or other specialised certifications). But for those starting out, it hits the sweet spot of breadth and practical know-how.
Another point: the certificate emphasises practical skills over theory. You won’t dive deeply into math or statistics theory (only some light introduction to things like sample size and data validity). Instead, the focus is on using tools to get results. This is ideal if you want to quickly become job-ready, though you may later choose to learn more statistics or advanced modelling depending on your career goals (which you can, once you have the foundation). The program does a good job addressing soft skills too – communication, problem solving, and ethical handling of data, which are crucial in real jobs and often get overlooked in purely academic courses.
Cost-benefit-wise, the certificate is relatively affordable compared to a semester of college or a coding bootcamp. For a few hundred dollars and a few months of effort, you get a credential backed by Google and the experience of completing a comprehensive project. The job connections through the employer consortium add further value, essentially giving you an “in” with many companies’ hiring pipelines. Even outside of the consortium, the Google name on the certificate tends to be well-regarded. Many graduates report that it helped them land interviews by showing initiative and verified skills.
In conclusion, the Google Data Analytics Professional Certificate is a practical, well-rounded program for anyone wanting to break into data analytics. It covers all the essential modules from understanding data to presenting insights, uses industry-standard tools (Excel, SQL, Tableau, R) that employers expect, and offers a flexible learning schedule. Upon completion, you’ll have a solid foundation to apply for junior data analyst positions and a project portfolio to demonstrate your abilities.
If your career goal is to work with data to solve problems and you’re willing to dedicate the time to self-study, this certificate could be the right fit to jump-start your journey in data analytics. It’s an accessible way to develop in-demand skills – and with data-driven decision-making becoming ever more important across industries, those skills can open the door to a range of opportunities.
Sources
- Google/Coursera – Data Analytics Professional Certificate (Program description and syllabus)
- Grow with Google – Data Analytics Certificate FAQ (Program details on content, tools, time, cost, and requirements)
- Franklin Univ. Marketplace – Google Data Analytics Certificate Overview (Learning outcomes for each course, career info)
- Coursera – Google Data Analytics Certificate Page (What you’ll learn, skills gained, employer info, graduate outcomes)
- Purdue Global Catalog – Credit for Google Data Analytics Certificate (Recognition of certificate for academic credit)


